When leadership needed operational metrics, someone had to go pull the data from multiple systems, assemble it in a spreadsheet, and put together a report. This process was slow, manual, and meant that the numbers leadership saw were always slightly stale. Questions during meetings often required follow-up because the data was not at hand.
Team leads were spending time compiling reports rather than acting on the insights. The metrics infrastructure was reactive: leadership had to ask for numbers instead of having them available on demand.
The team built a centralized leadership dashboard (the "Ops Command Center") that replaced manual data pulls with real-time views of team workload, project health, and operational performance. The dashboard was designed with input from team leads so the metrics answer the questions leadership actually asks.
Behind the dashboard, n8n automations track all Jira requests, calculate their metrics, and send results to a Google Sheets database. A separate workflow tracks client meeting time and communication patterns. The Replit-hosted app serves as the UI layer on top of this data, giving leadership deep-dive views across approvals, QA, speed-to-launch, audits, anomalies, and more.
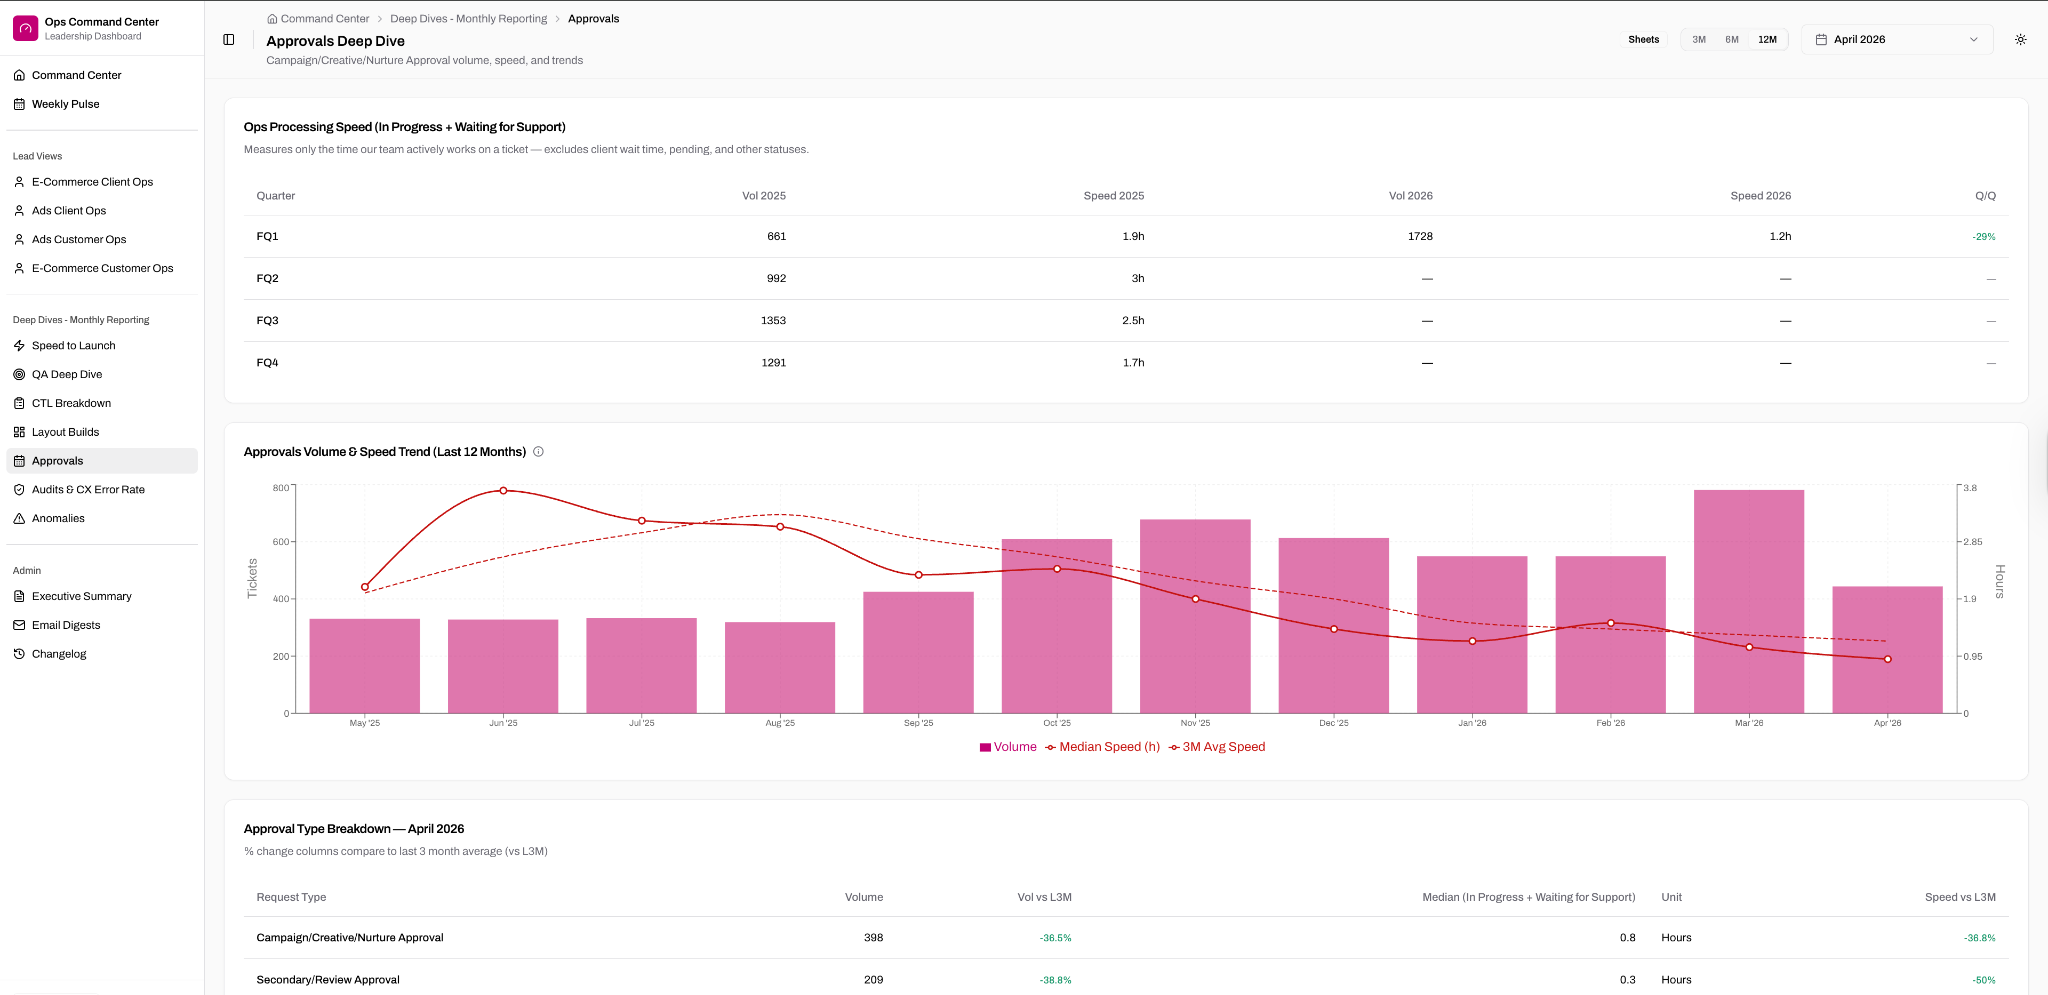
The Ops Command Center: a Replit-hosted dashboard with deep-dive views across approvals, QA, speed-to-launch, audits, anomalies, and more. Sidebar navigation gives leadership self-serve access to every operational metric.
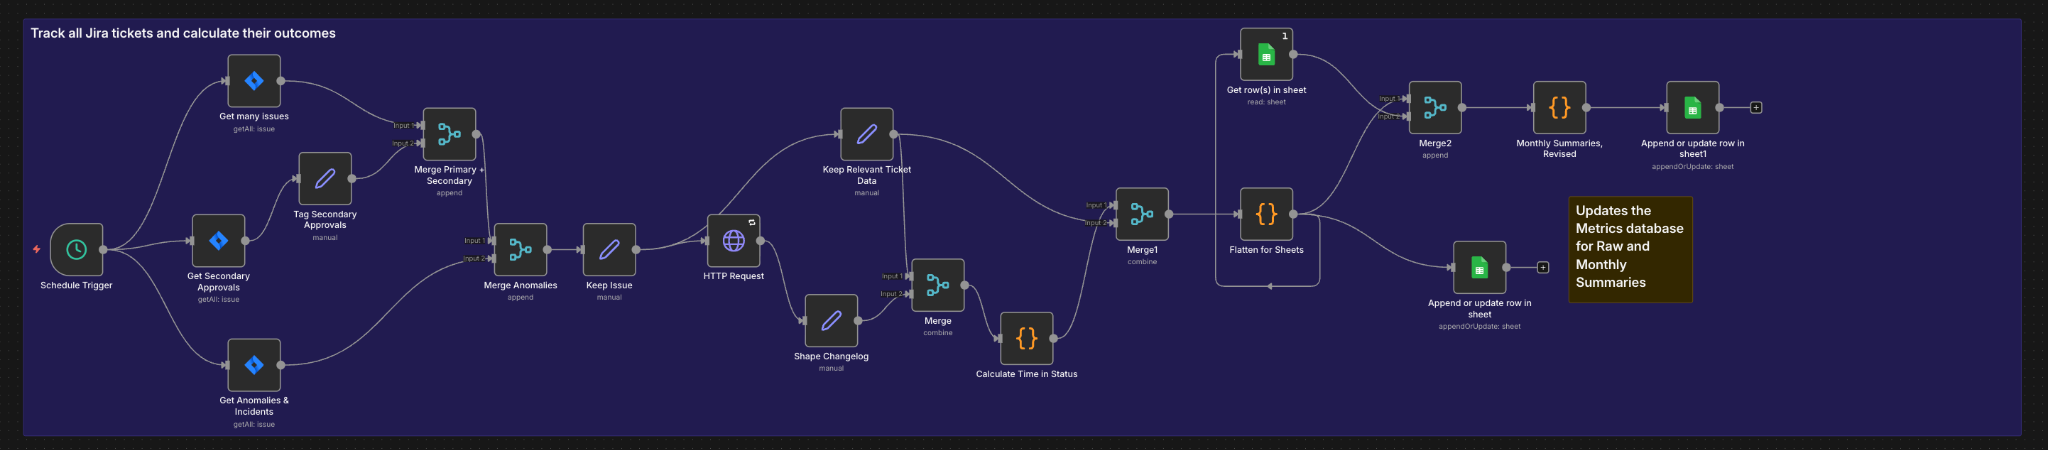
The n8n automation that tracks all Jira requests, calculates their metrics, and updates the database for raw and monthly summaries.
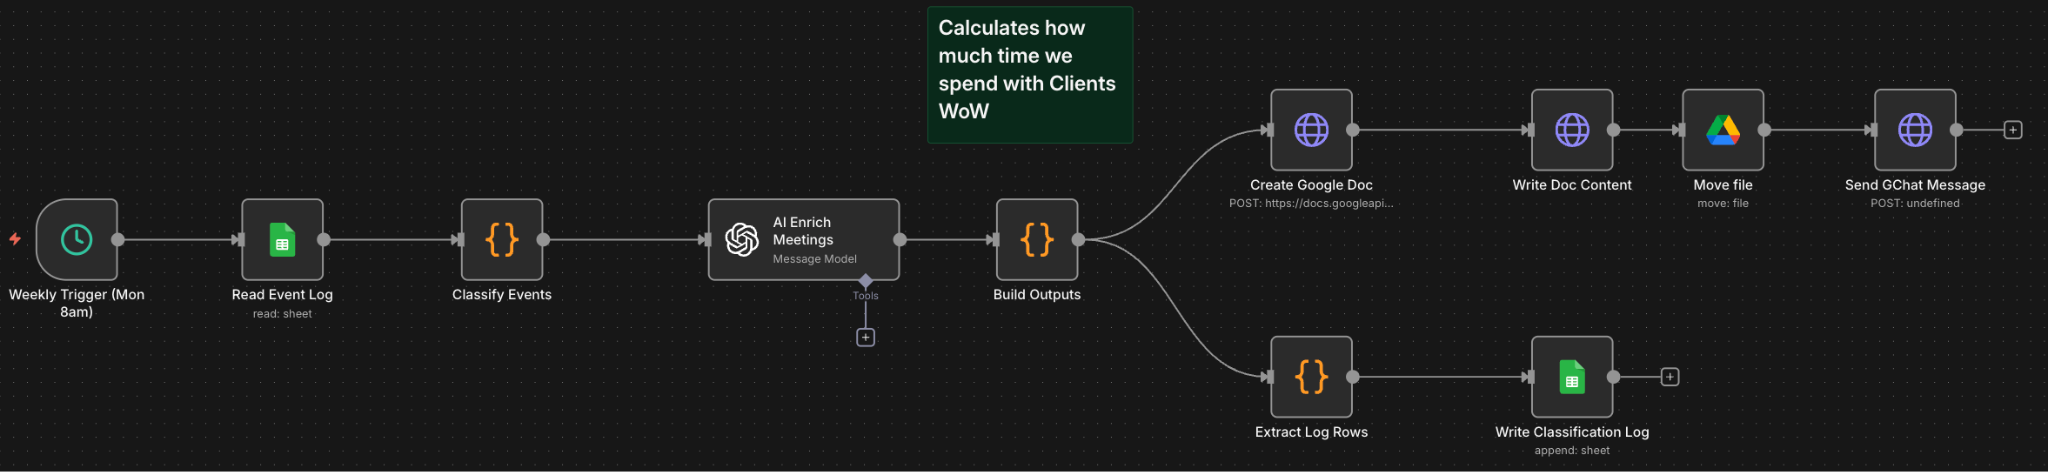
A separate n8n workflow that calculates how much time client teams spend in meetings week-over-week, enriching the leadership view with communication insights.
The prompt above is a starting point, not a one-shot solution. The actual build required multiple iterations: refining instructions based on output, uploading reference documents for context, mapping the right tooling and integrations, and working through edge cases. Treat this as the brief that kicks off the conversation, not the conversation itself.
The Ops Command Center replaced manual data pulls and spreadsheet-based reporting with real-time views that leadership can access on demand. Team leads no longer spend time compiling reports, and leadership no longer has to wait for numbers. The dashboard surfaces the metrics that matter for operational decisions and updates automatically from the source systems. Deep-dive views across approvals, QA, speed-to-launch, audits, and anomalies give leadership self-serve access to every operational metric without requesting a report.